Types of Maps | Exploring Geographic & Thematic Varieties
Introduction to the Diversity of Maps
Maps are much more than simple representations of the Earth's surface; they are intricate tools that offer a window into various aspects of our world. With a wide array of maps available, each serves a distinct purpose, catering to the needs of students, hikers, researchers, and more, by providing insights into geographic boundaries, terrain navigation, or climate patterns.
Maps fall into two primary categories: reference maps and thematic maps.
Reference maps include political, physical, and topographic maps, which are indispensable for grasping an area's basic geography. They detail geographic boundaries, the Earth's physical features, and cultural elements such as cities and roads.
Thematic maps, however, zero in on specific themes or data like weather patterns, economic activities, or species distribution. These maps are instrumental in analyzing and visualizing particular information across diverse geographic locales.
This article aims to explore the spectrum of maps, from geographic to thematic varieties. We'll uncover how political maps clarify state and national boundaries, physical maps showcase the natural landscape, and topographic maps offer an in-depth look at the Earth's surface.
Additionally, we'll dive into thematic maps, including weather and geologic maps, demonstrating their role in interpreting specific data sets.
Geographic Maps
Geographic maps are indispensable tools for understanding the Earth's surface, its layout, and features. These maps are divided into various categories, each tailored for a specific purpose.
Political Maps
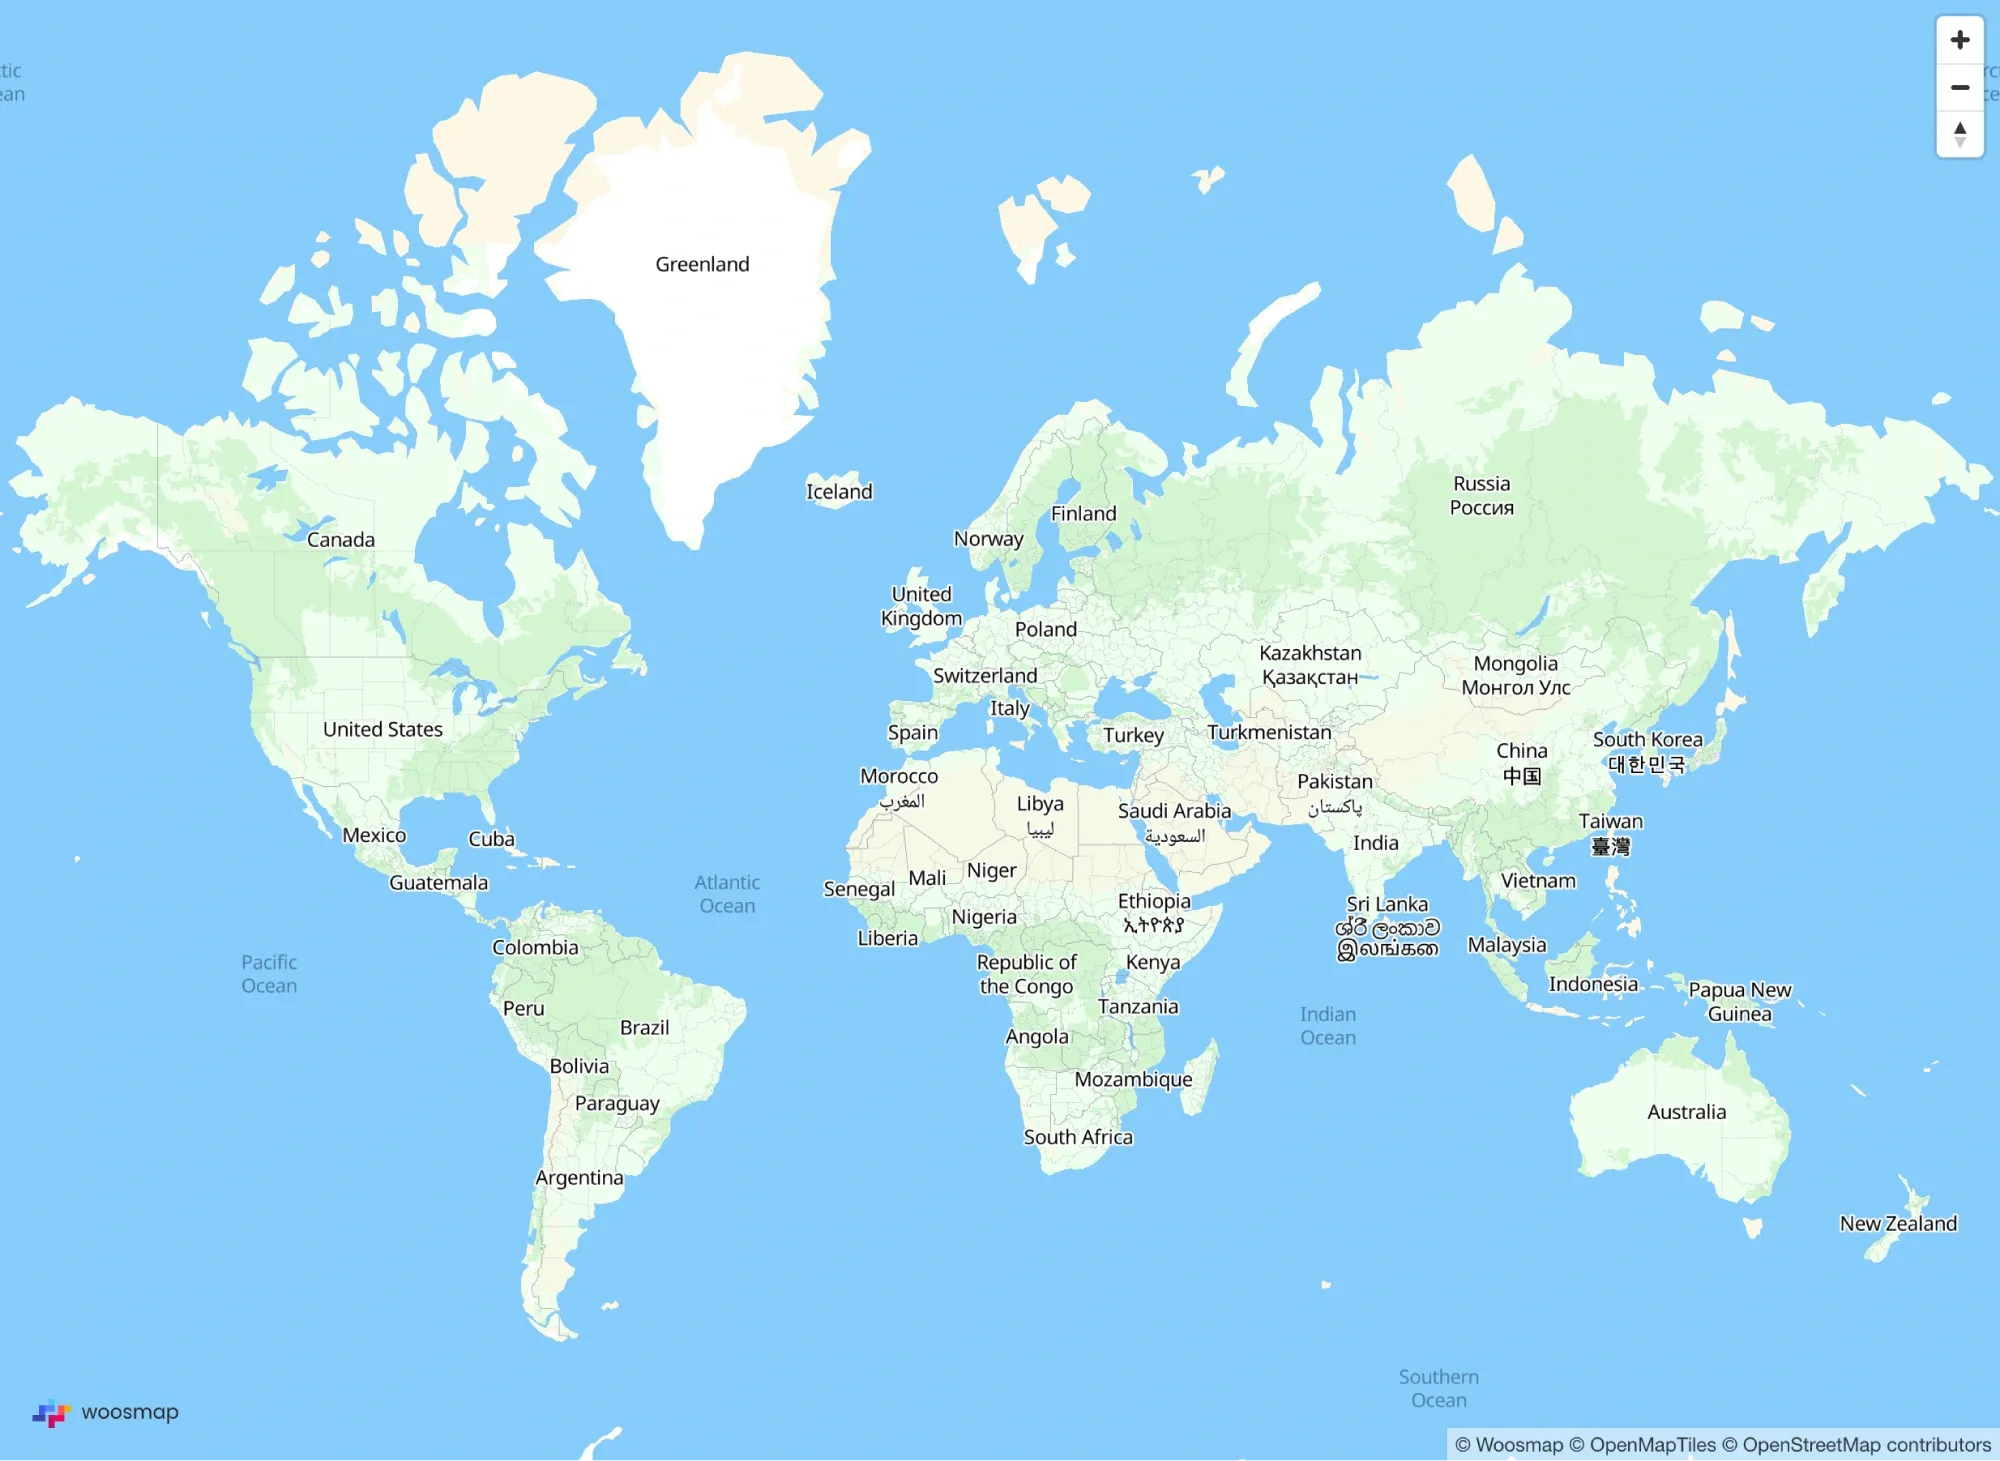
Political maps are crafted to illustrate the boundaries and names of countries, states, counties, and other political units. They play a key role in grasping the geopolitical landscape and are widely used in education, international relations, and government planning. These maps typically feature capital cities, major cities, and international borders, proving to be essential for the study of global politics and geography.
Credits: Woomap Map
For example, a political map of the United States would detail the boundaries of its 50 states, including their capitals and significant cities, thereby aiding in understanding the administrative divisions and territorial control across different regions.
Physical Maps
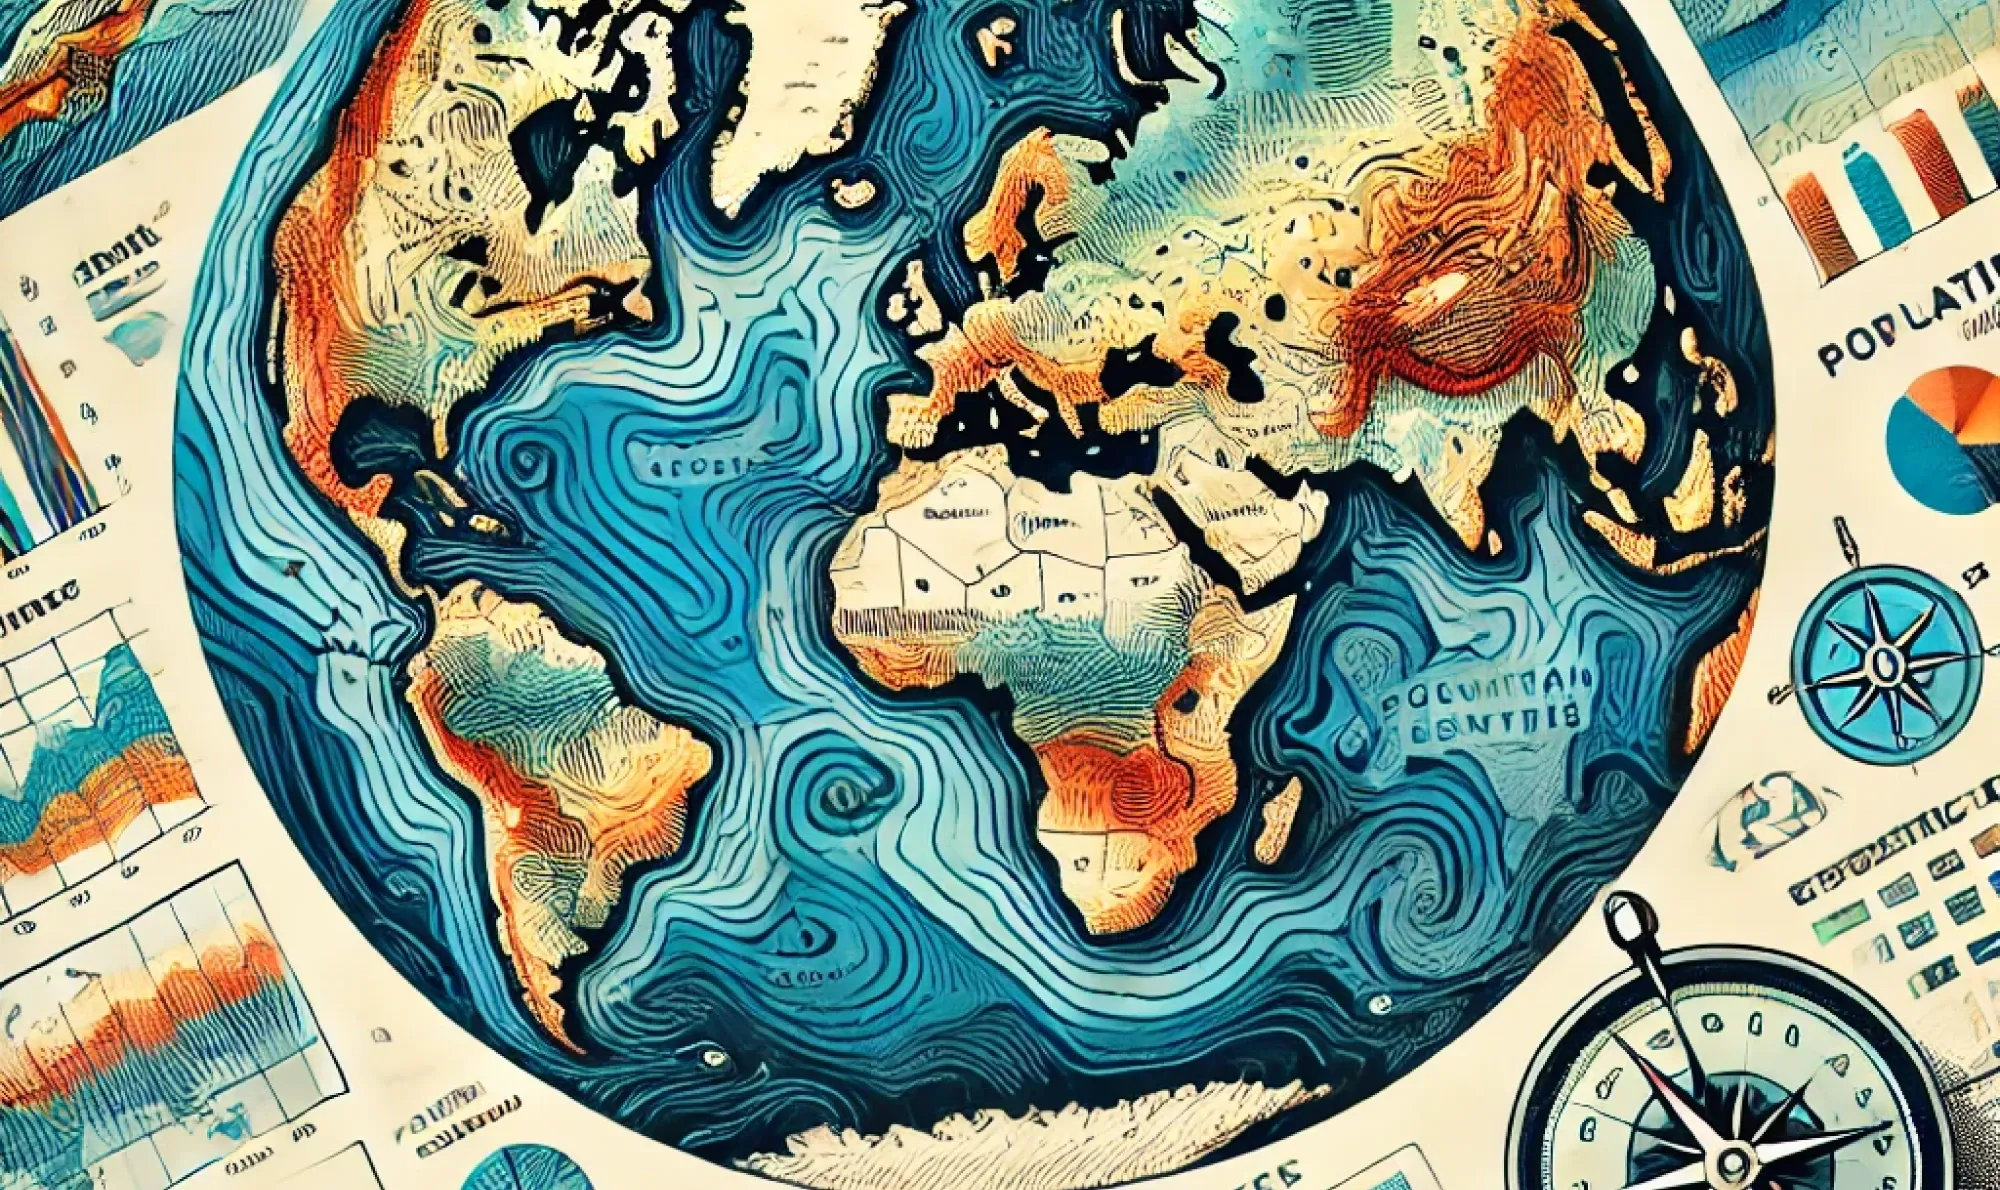
Physical maps, or relief maps, concentrate on showcasing the Earth's natural features.
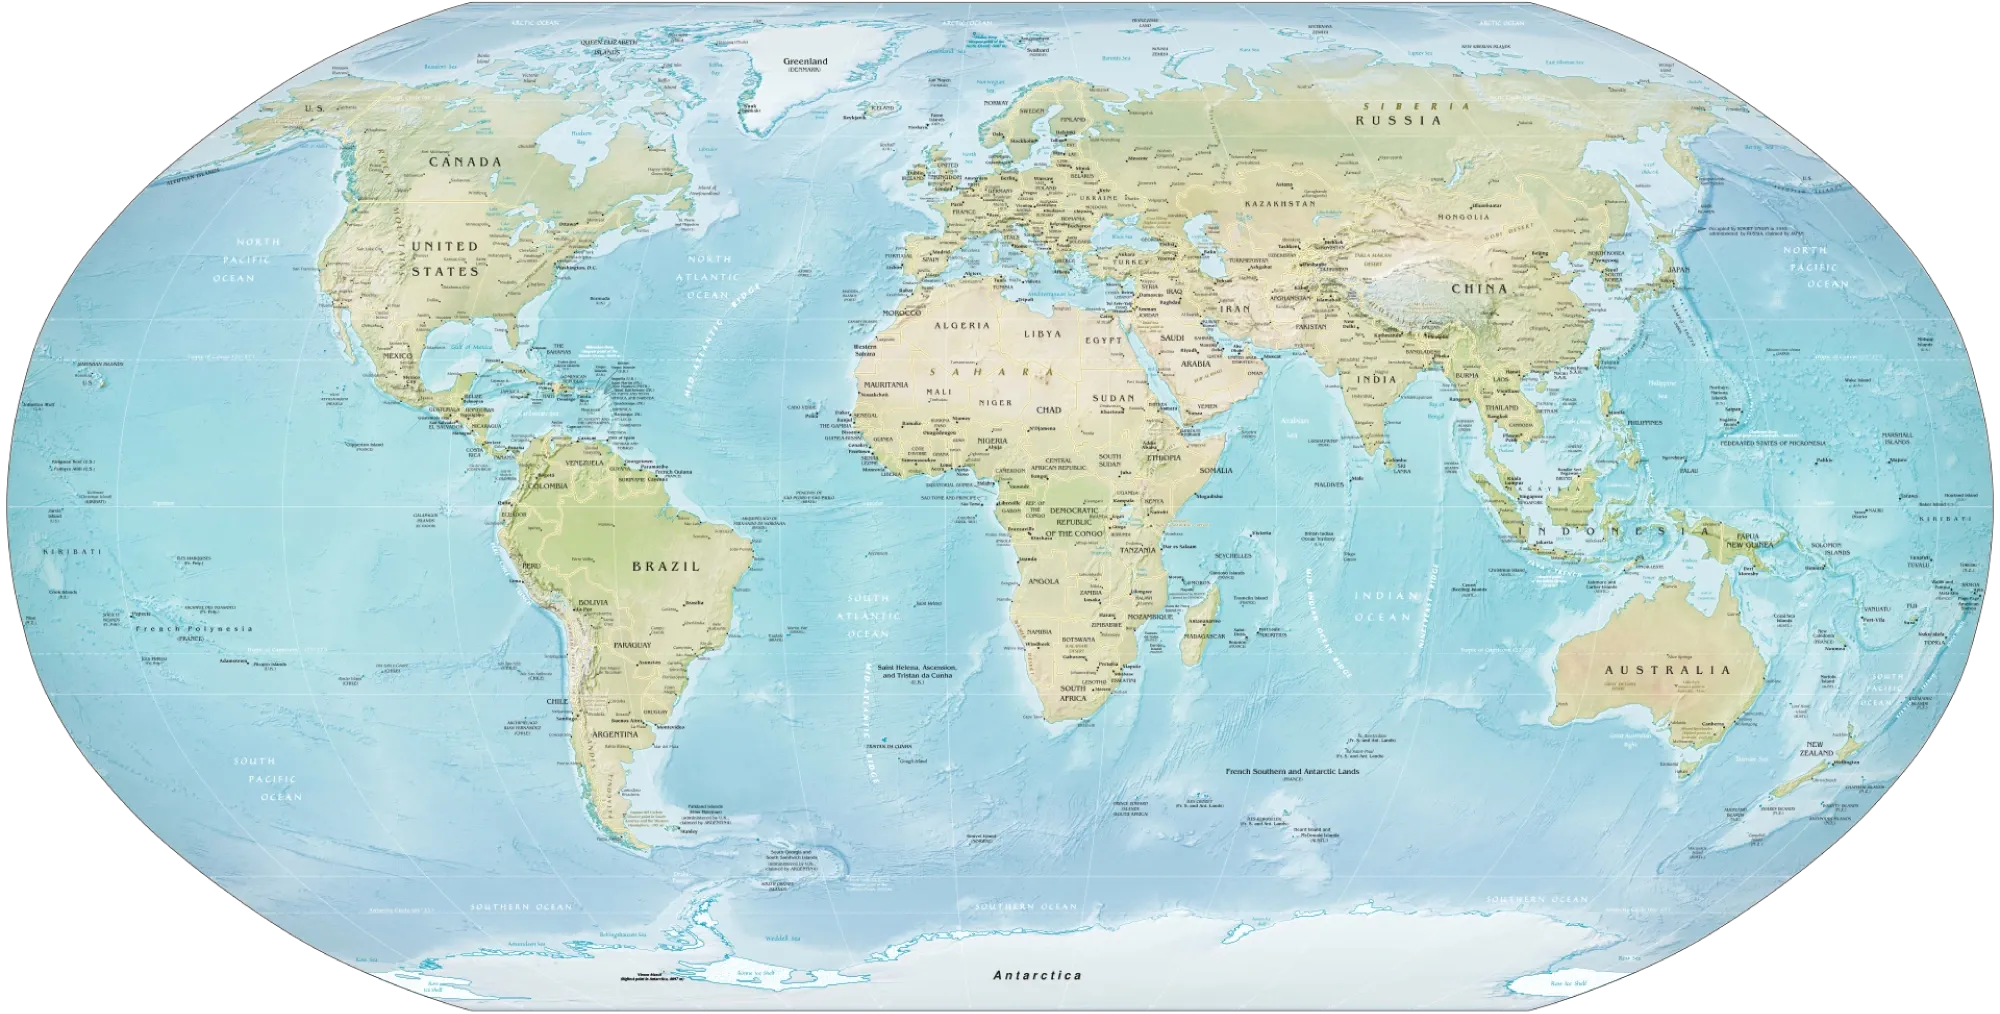
These maps portray the physical landscape, highlighting mountains, valleys, rivers, lakes, and oceans. Techniques such as color coding and shaded relief are employed to differentiate elevations and landforms. For instance, green may symbolize forests, tan deserts, and blue water bodies.
Physical maps are vital for comprehending the Earth's topography, serving as key resources for geologists, environmental scientists, and outdoor enthusiasts. They offer a graphical representation of the Earth's physical attributes, essential for planning various activities like hiking, mining, or urban development.
Credits: wikipedia
Topographic Maps
Topographic maps represent a specialized category of physical maps that depict terrain shape and elevation through contour lines.
These lines, drawn at regular intervals, convey changes in elevation, enabling the visualization of the three-dimensional landscape on a two-dimensional surface. Besides contour lines, topographic maps include features like rivers, lakes, and roads, enhancing their versatility. The U.S. Geological Survey (USGS) is known for producing detailed topographic maps for recreation, scientific analysis, and emergency response, beneficial for hikers, engineers, and anyone requiring accurate terrain information.
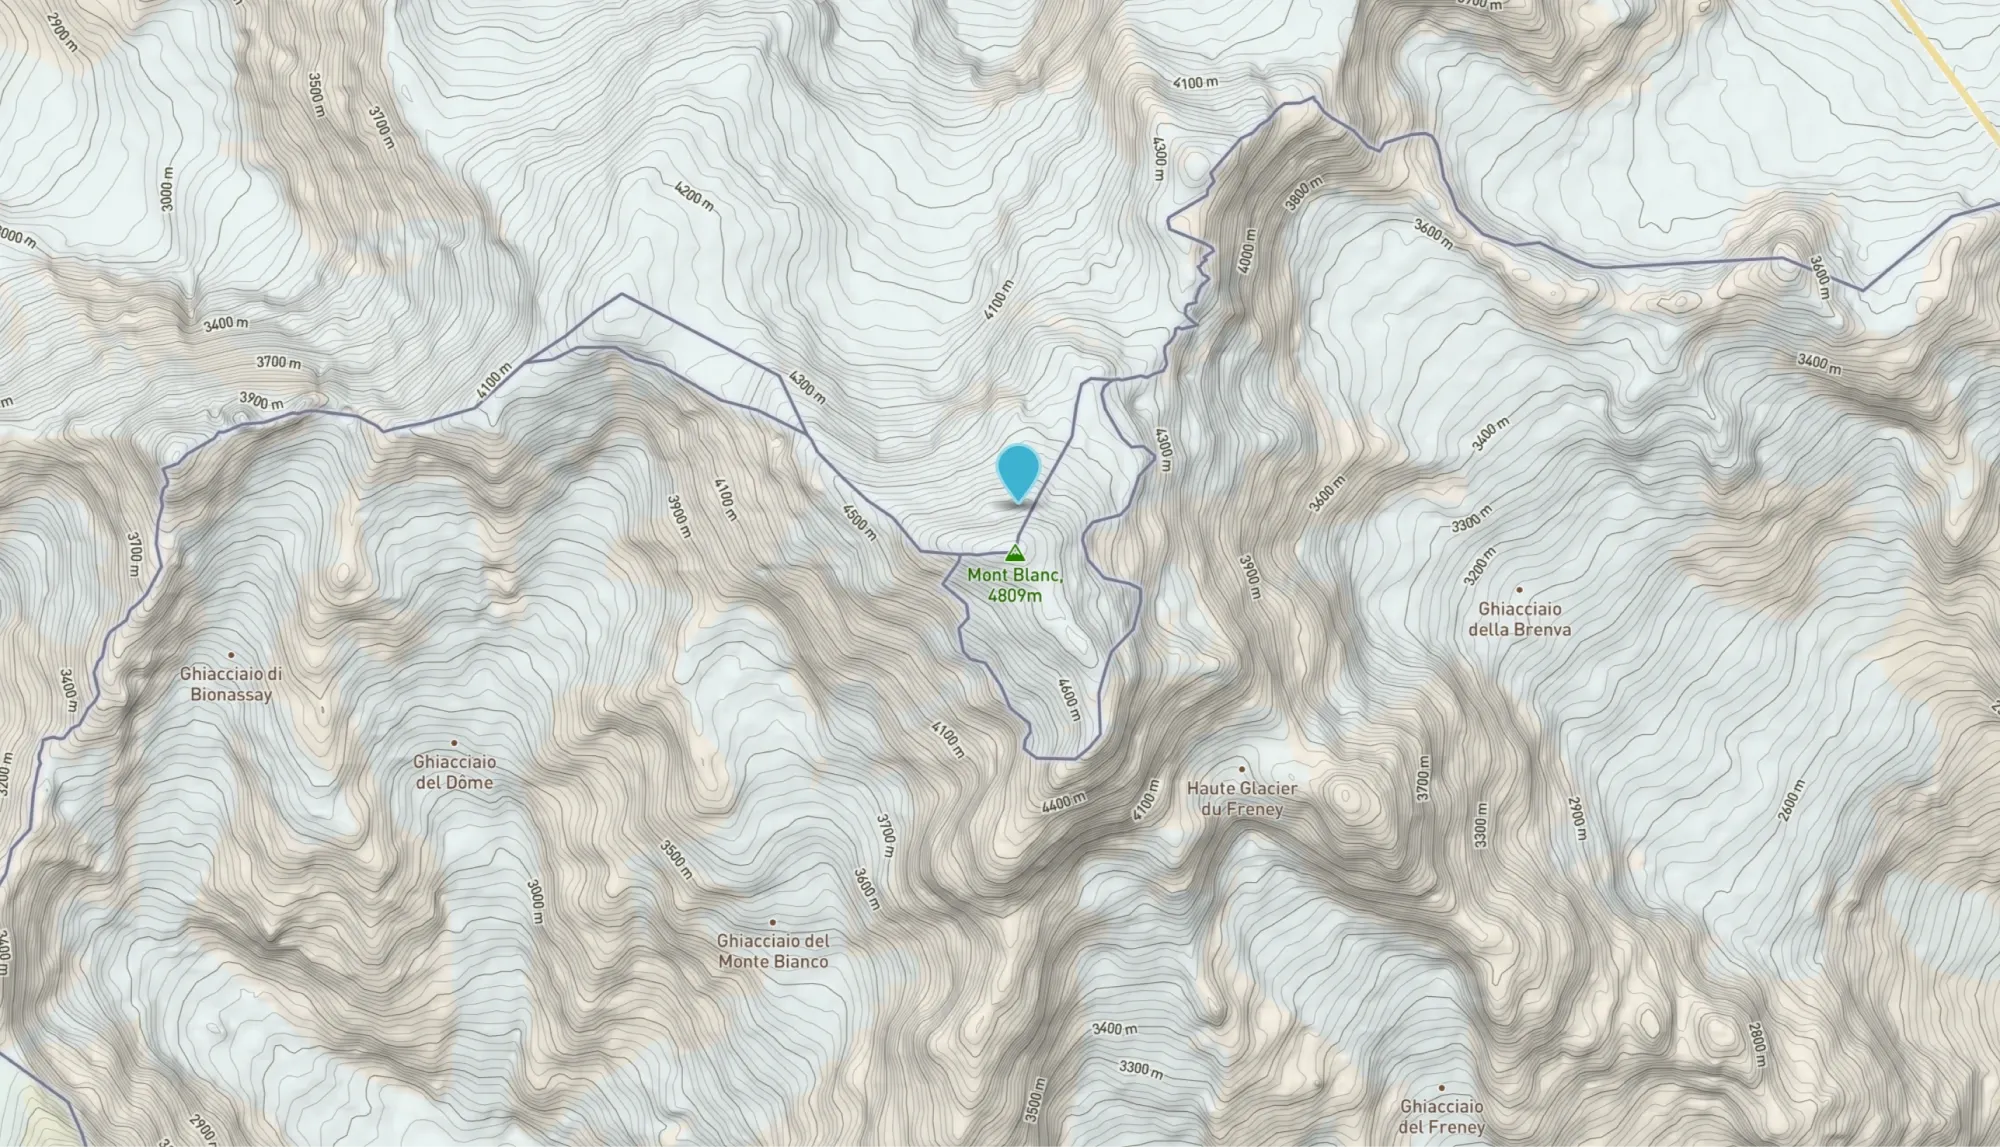
Credits: ngmdb.usgs.gov
Road and Street Maps
Road and street maps, also known as street highway maps, are designed to facilitate navigation in both urban and rural settings.
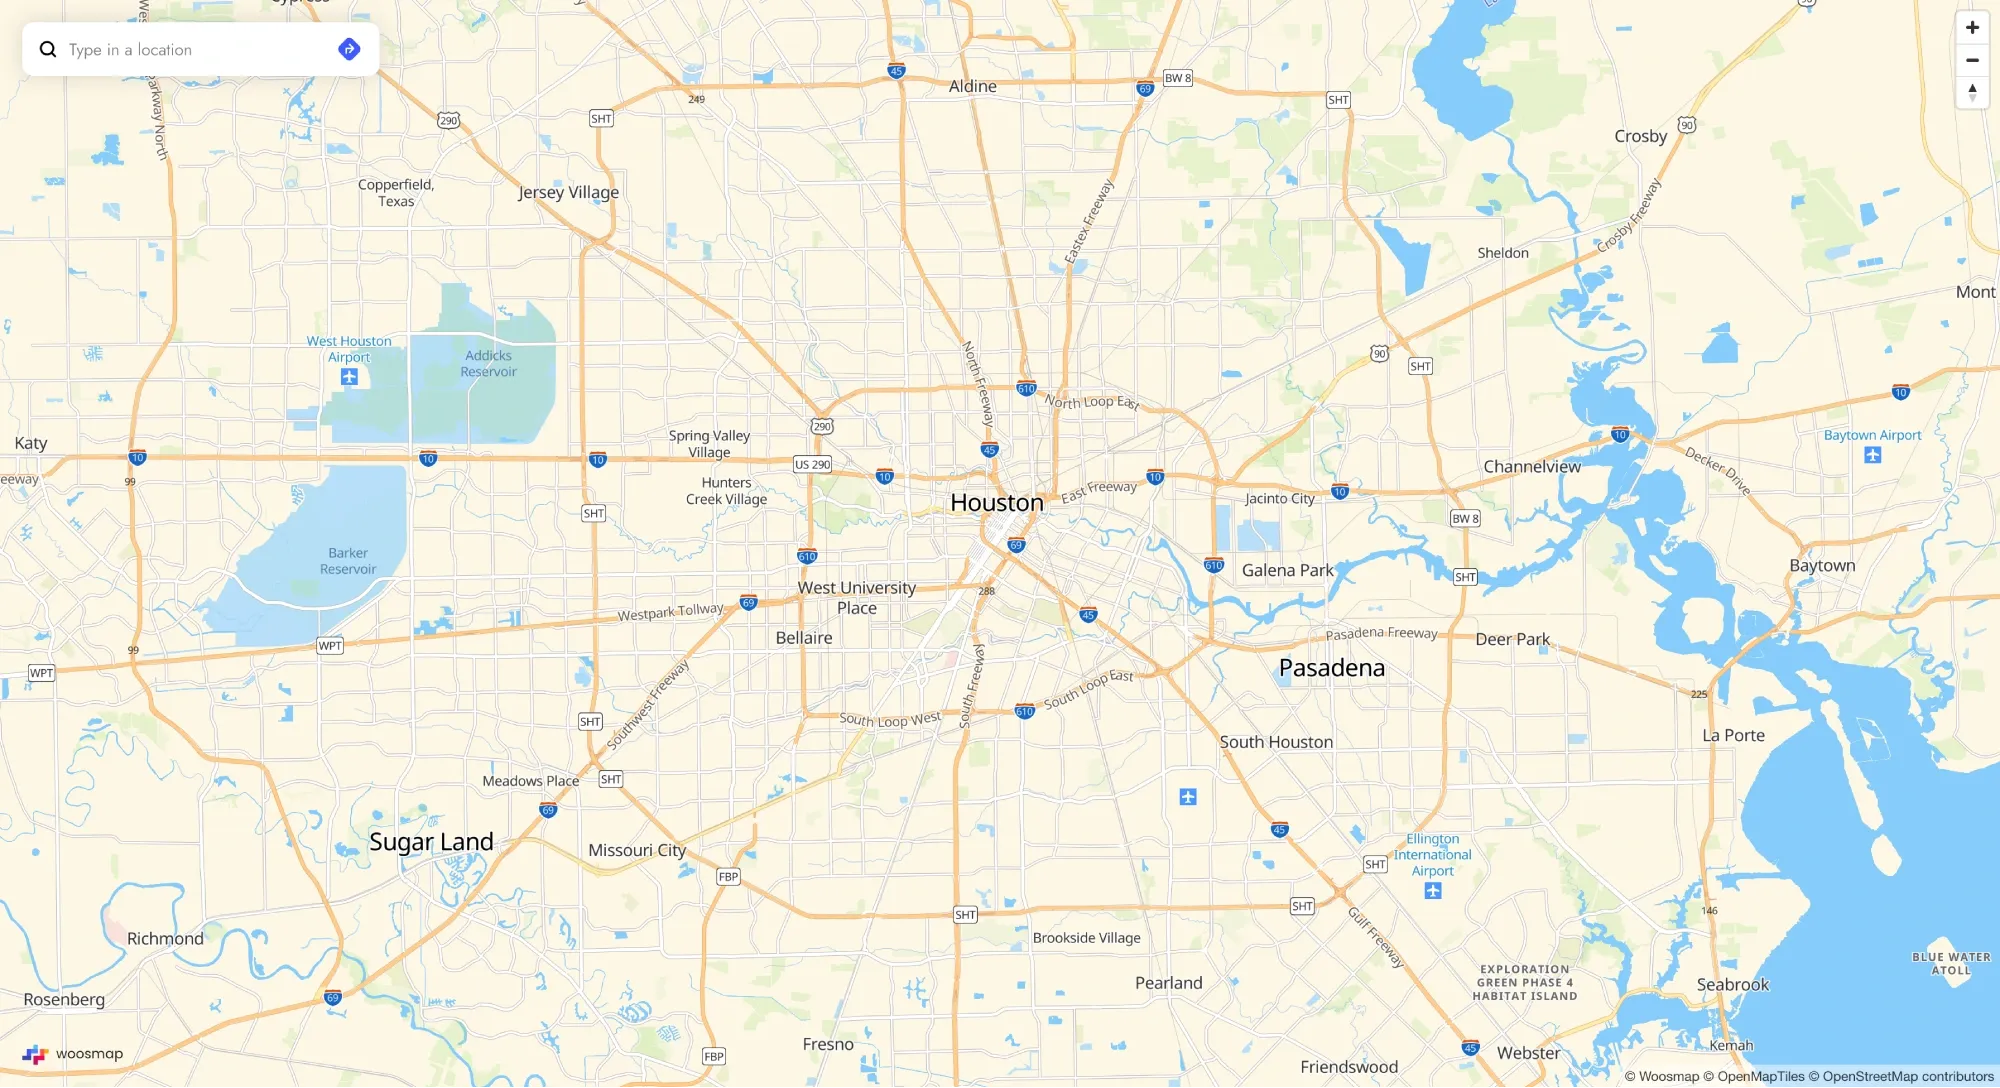
These maps detail the network of roads, highways, streets, and other transportation routes, often including additional information on traffic patterns, road conditions, and points of interest such as restaurants, gas stations, and landmarks. Road and street maps are indispensable for everyday navigation, supporting drivers, cyclists, and pedestrians alike. They are also essential for logistics companies in route optimization and urban planners in the design and management of transportation infrastructures.
Map of Texas, USA
View of Houston - Credits: Woosmap Map - Map Texas USA
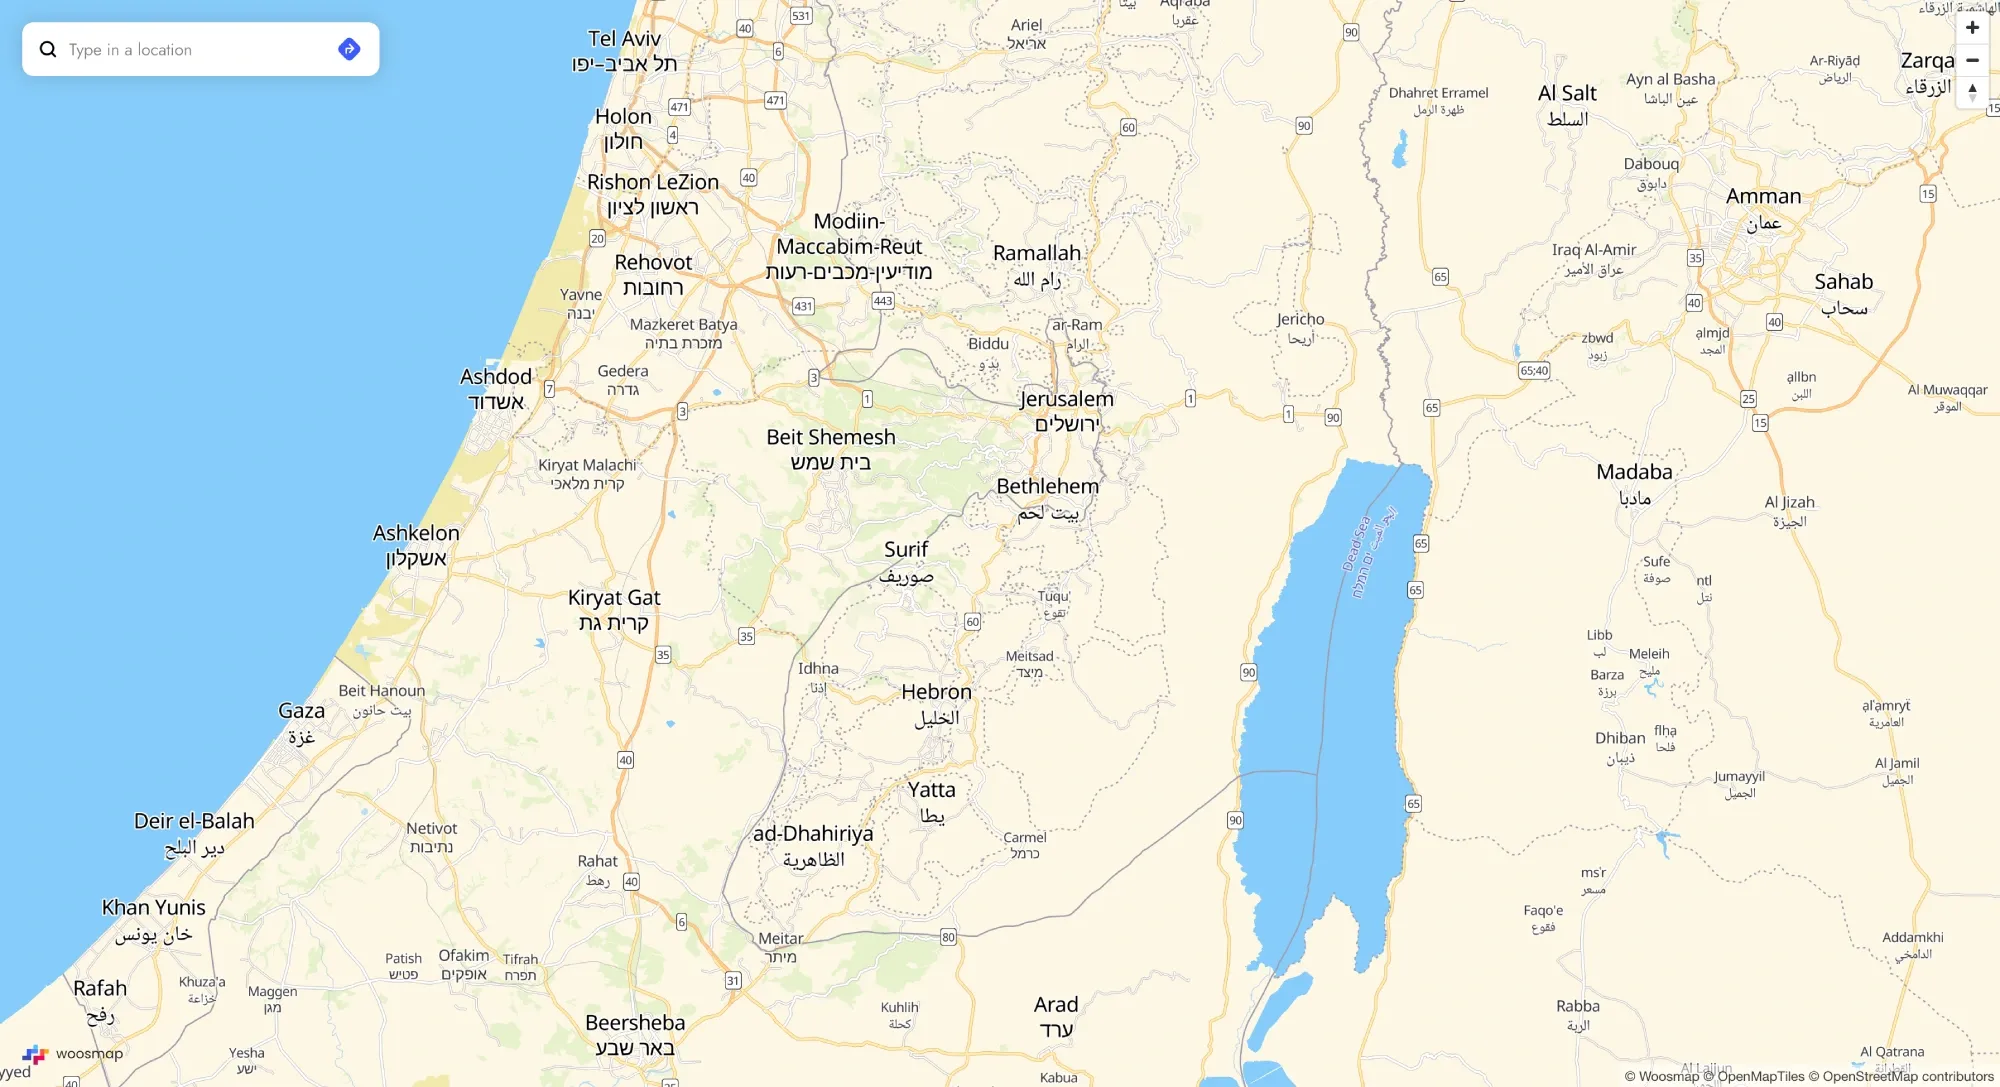
Map of Israel
View of Ramallah (Palestine), Jerusalem(Israel/Palestine) and Betlehem (Palestine)
Credits: Woosmap Map - Map of Israel, IL
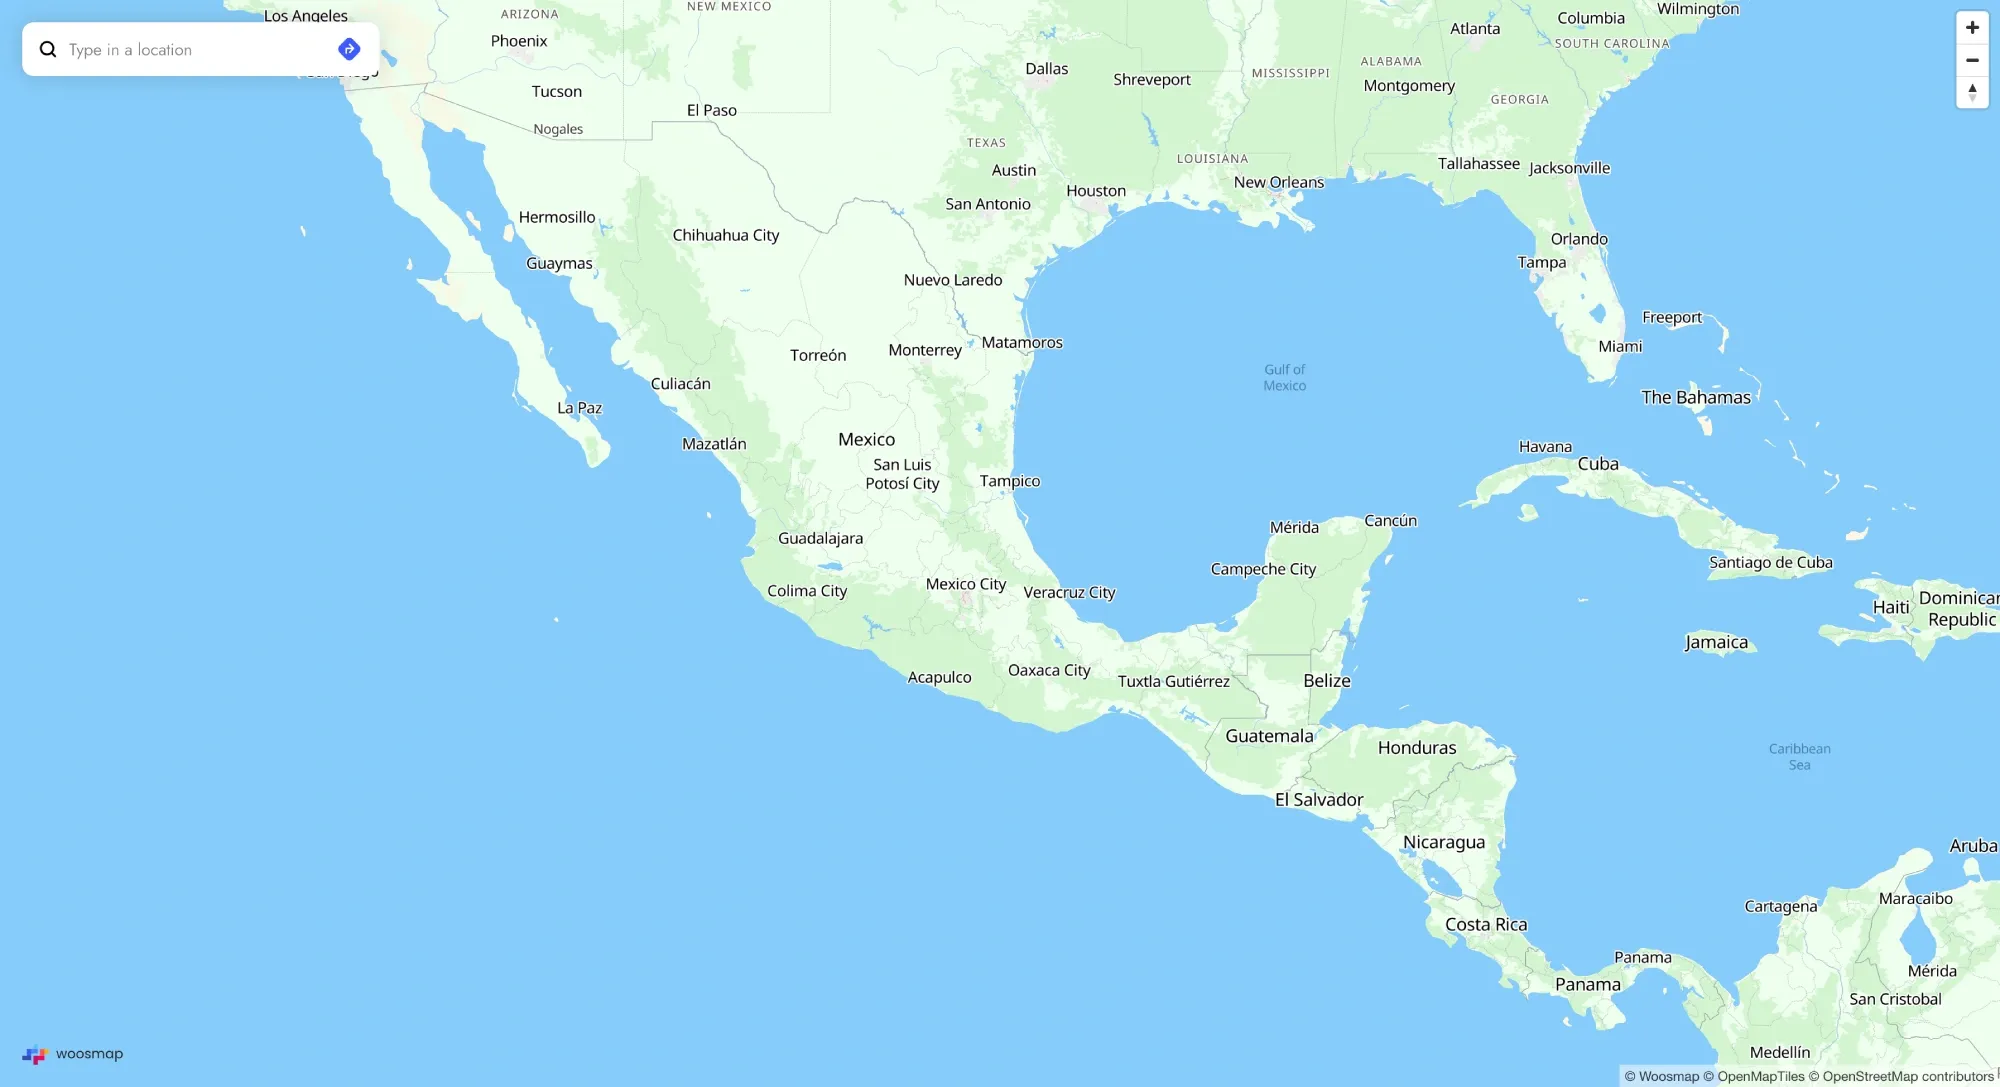
Map of Mexico
View of Ramallah (Palestine), Jerusalem(Israel/Palestine) and Betlehem (Palestine)
Credits: Woosmap Map - Map of Mexico
Thematic Maps
Thematic maps are potent instruments crafted to communicate precise information about a specific theme or subject. They enable a richer comprehension of geographic data and facilitate the recognition of spatial patterns and trends.
Climate Maps
Climate maps, a subset of thematic maps, concentrate on the climatic conditions and phenomena within a certain area. They are capable of illustrating a variety of climate-related data, including temperature zones, precipitation levels, and regions susceptible to natural disasters such as hurricanes or sea-level rise. For example, a climate map might illustrate the distribution of rainfall across different areas, aiding in the understanding of weather patterns and their effects on sectors like agriculture, urban planning, and environmental management.
Heat maps, frequently utilized in climate research, visualize the intensity of weather phenomena, like drought conditions or heatwaves, independently of geographical boundaries. This approach is instrumental in pinpointing high-risk areas and devising mitigation strategies.
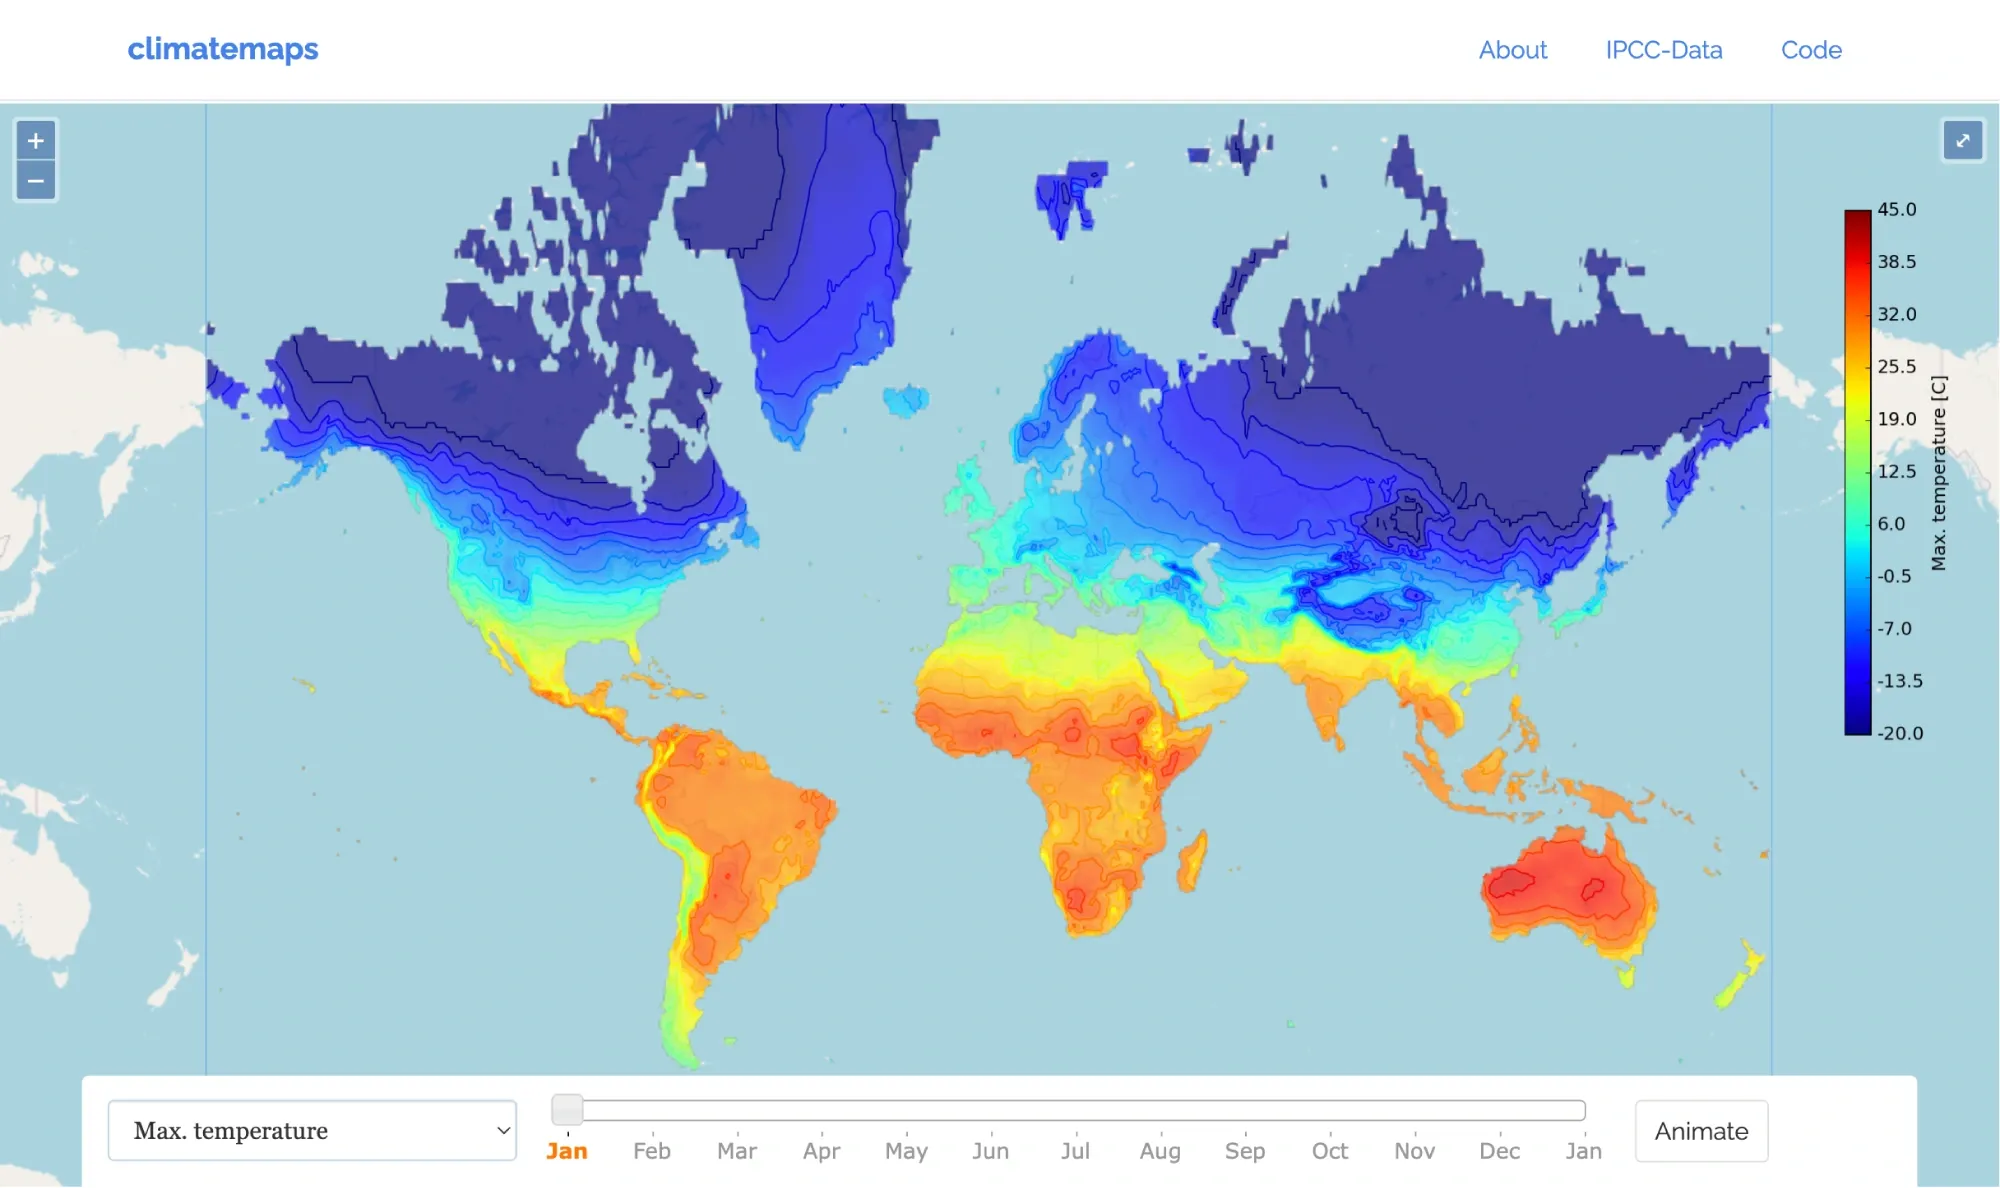
Credits: climatemaps.romgens.com Climate Map - Max Temperatures
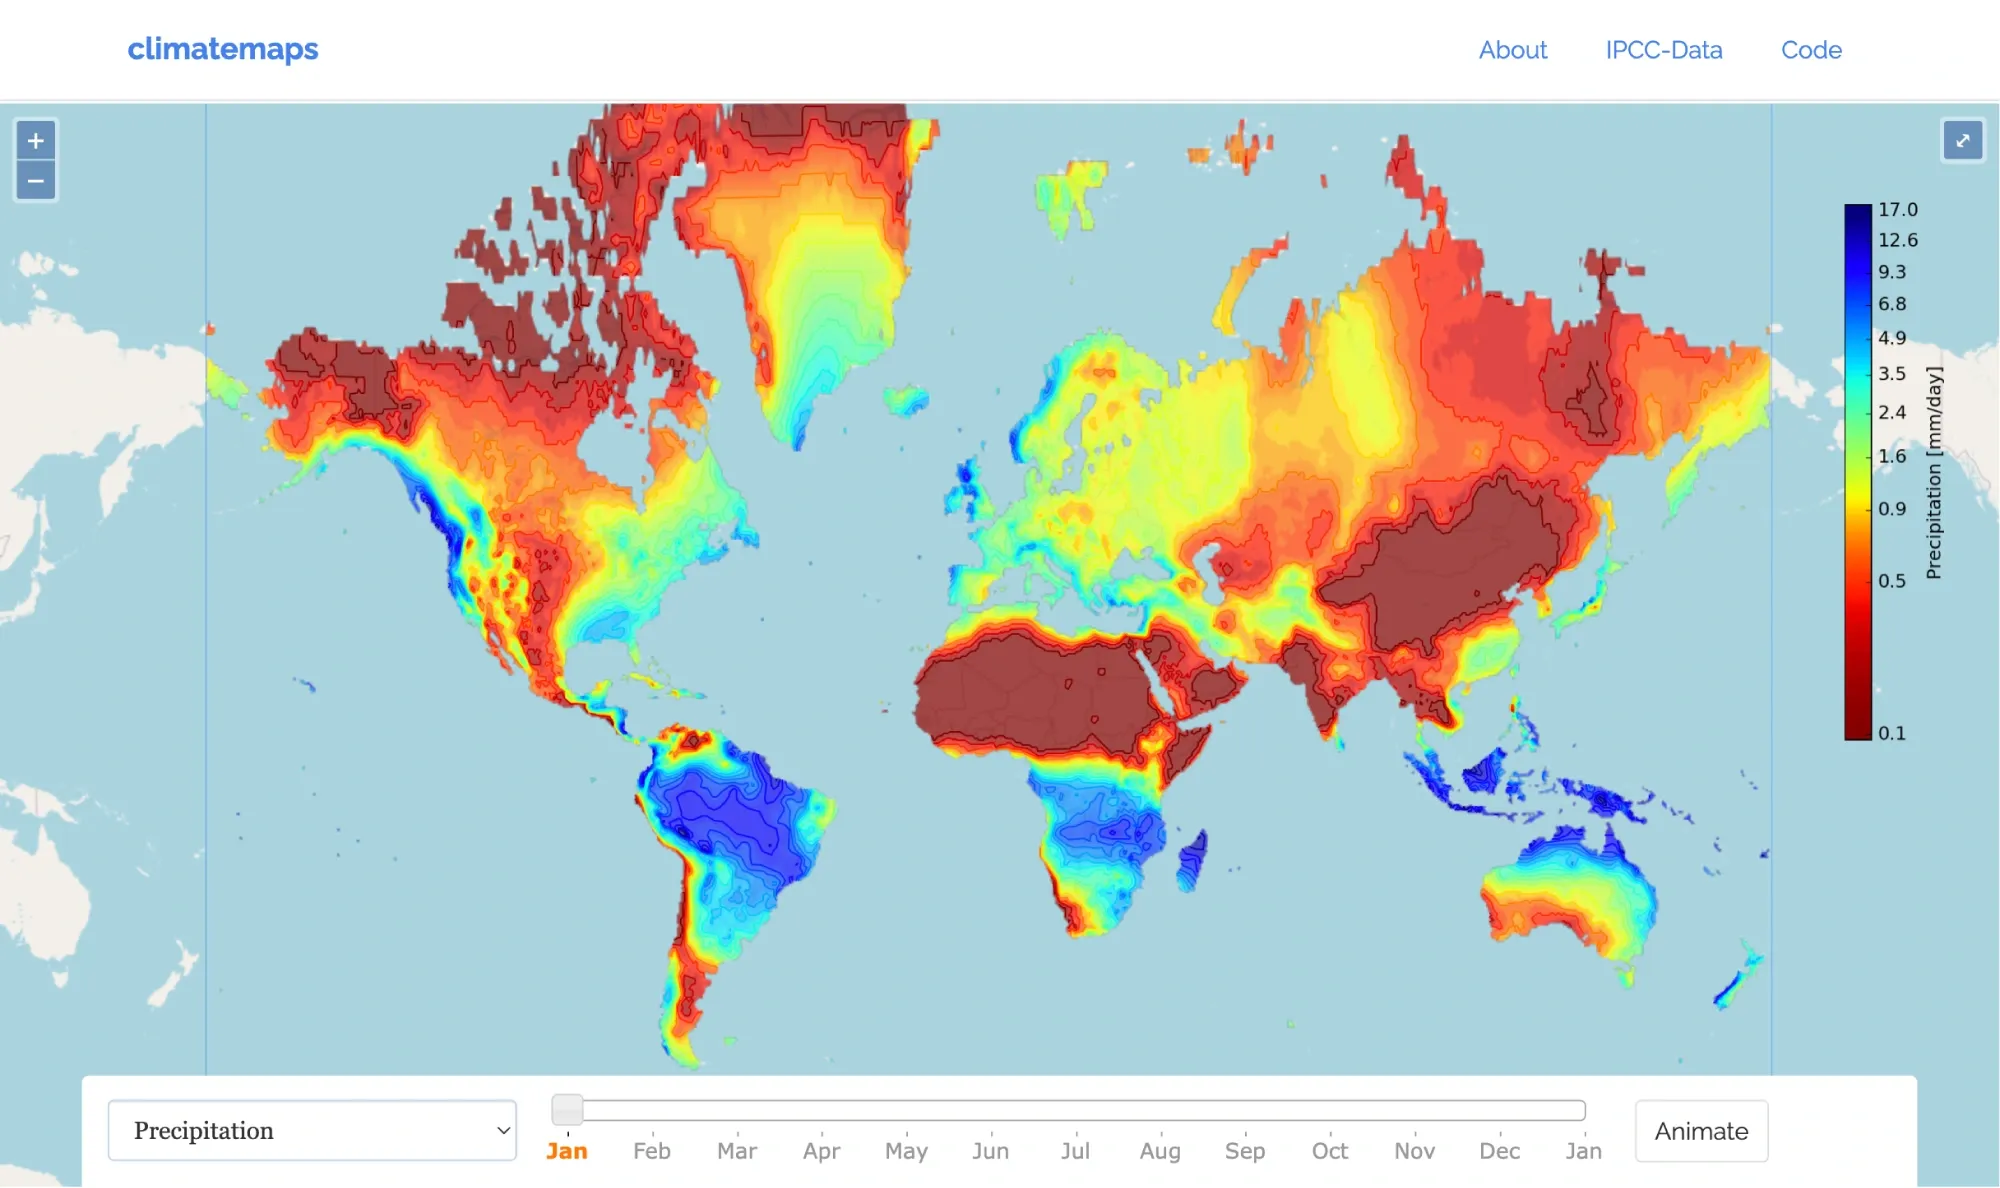
Credits: climatemaps.romgens.com Climate Map - Precipitations
Economic or Resource Maps
Economic or resource maps spotlight economic activities, the distribution of resources, and financial data across various geographic locales. These maps can represent metrics such as employment rates, sales performance, market share, and the locations of natural resources like oil, gas, or minerals. For instance, a choropleth map might be employed to illustrate the economic performance of different regions, with colors denoting areas of higher or lower economic activity.
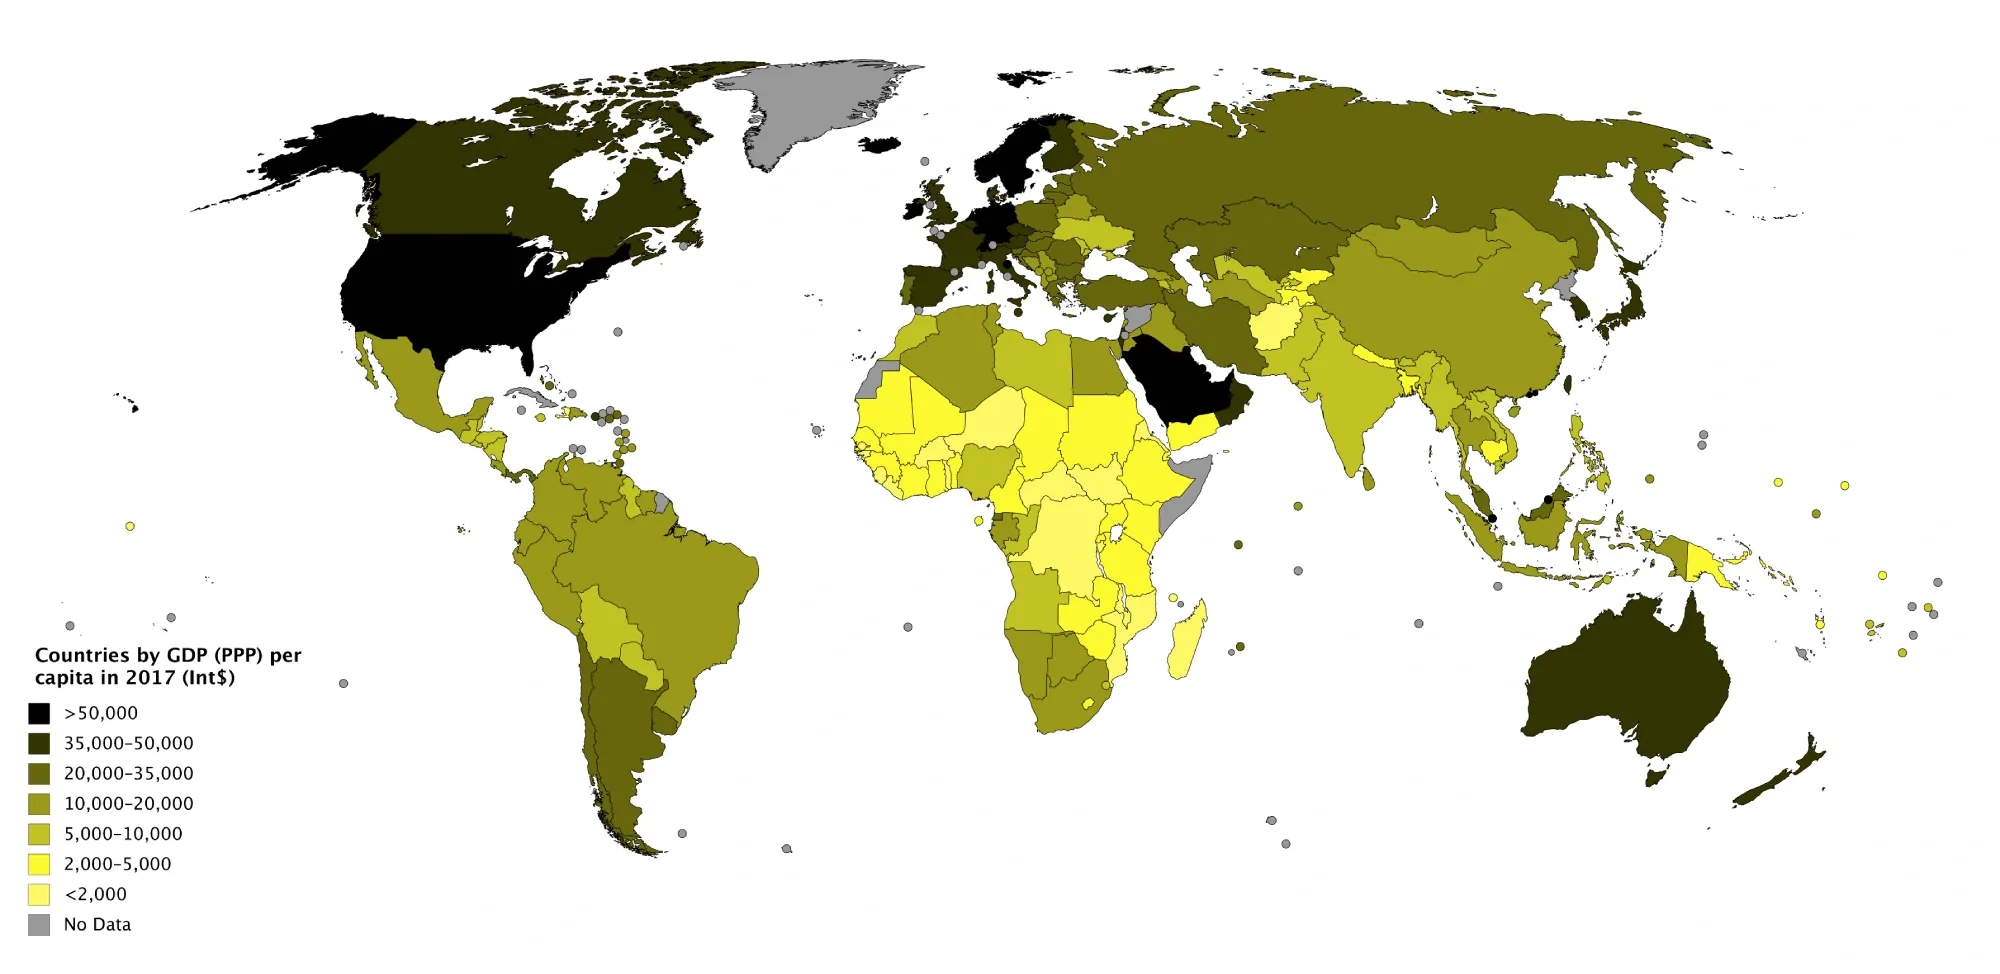
Credit: JackintheBox - Wikipedia
Such maps are invaluable for businesses aiming to enhance their operations, discover new market opportunities, and make well-informed strategic decisions. Proportional symbol maps, where symbols of different sizes indicate data points like market size or total customers in various regions, are particularly effective in visualizing economic activity concentration and identifying areas of potential or saturation.
Population Density Maps
Population density maps depict the spread of population across various geographic areas, serving as essential tools for urban planning, demographic studies, and public health research. Choropleth maps, which use darker shades to represent higher population densities and lighter shades for lower densities, are commonly utilized for this purpose. Alternatively, graduated symbol maps scale symbols to represent the population size in each area.
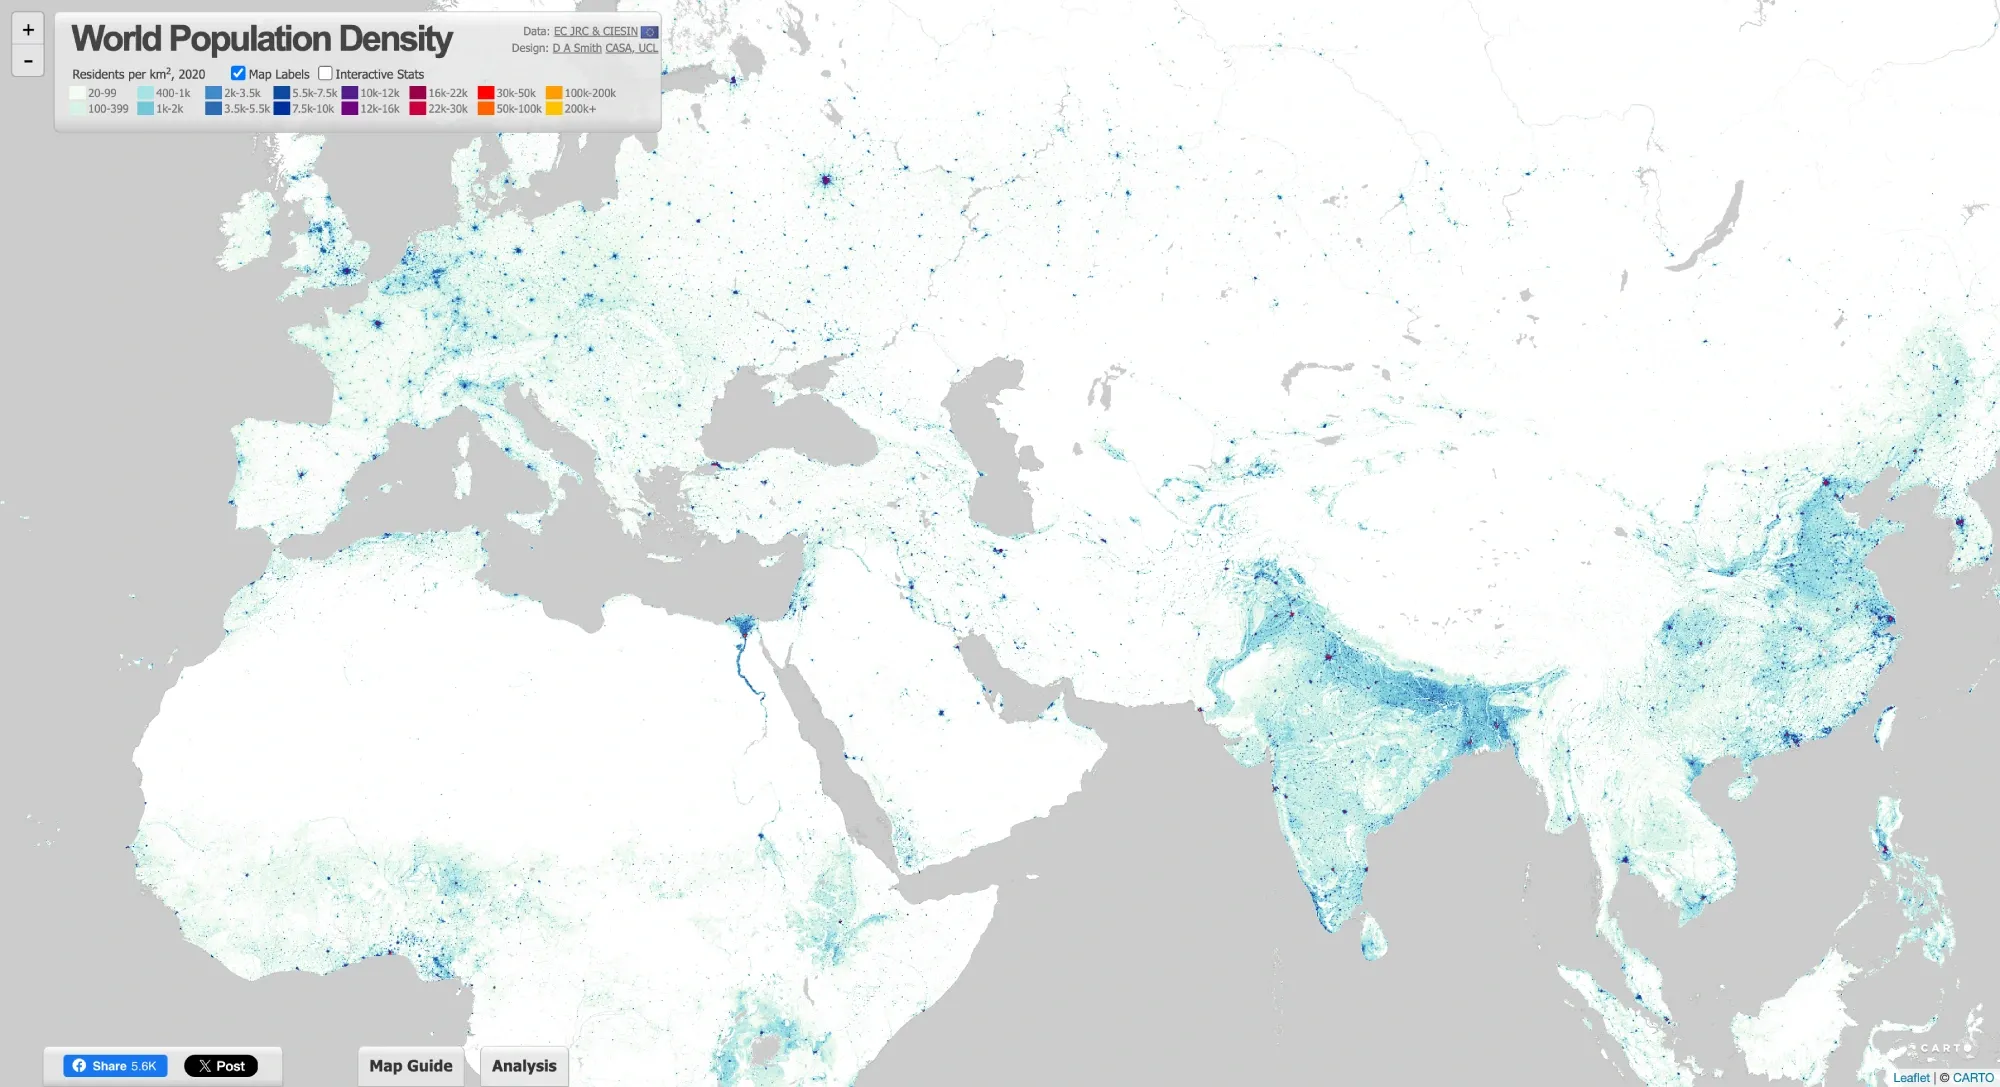
Credit: luminocity3d.org
These maps are essential for understanding spatial inequalities, guiding infrastructure development, and shaping policies on migration and resource distribution. For example, a population density map of a city can assist planners in pinpointing areas in need of enhanced public services or infrastructure development.
Historical or Evolution Maps
Historical or evolution maps are thematic maps that illustrate changes over time within a particular theme or subject. These maps can demonstrate the evolution of population distribution, economic activities, or environmental changes through different periods. Animated time-series maps are especially valuable, as they can animate data over time, offering insights into trends and patterns that static maps may not reveal.
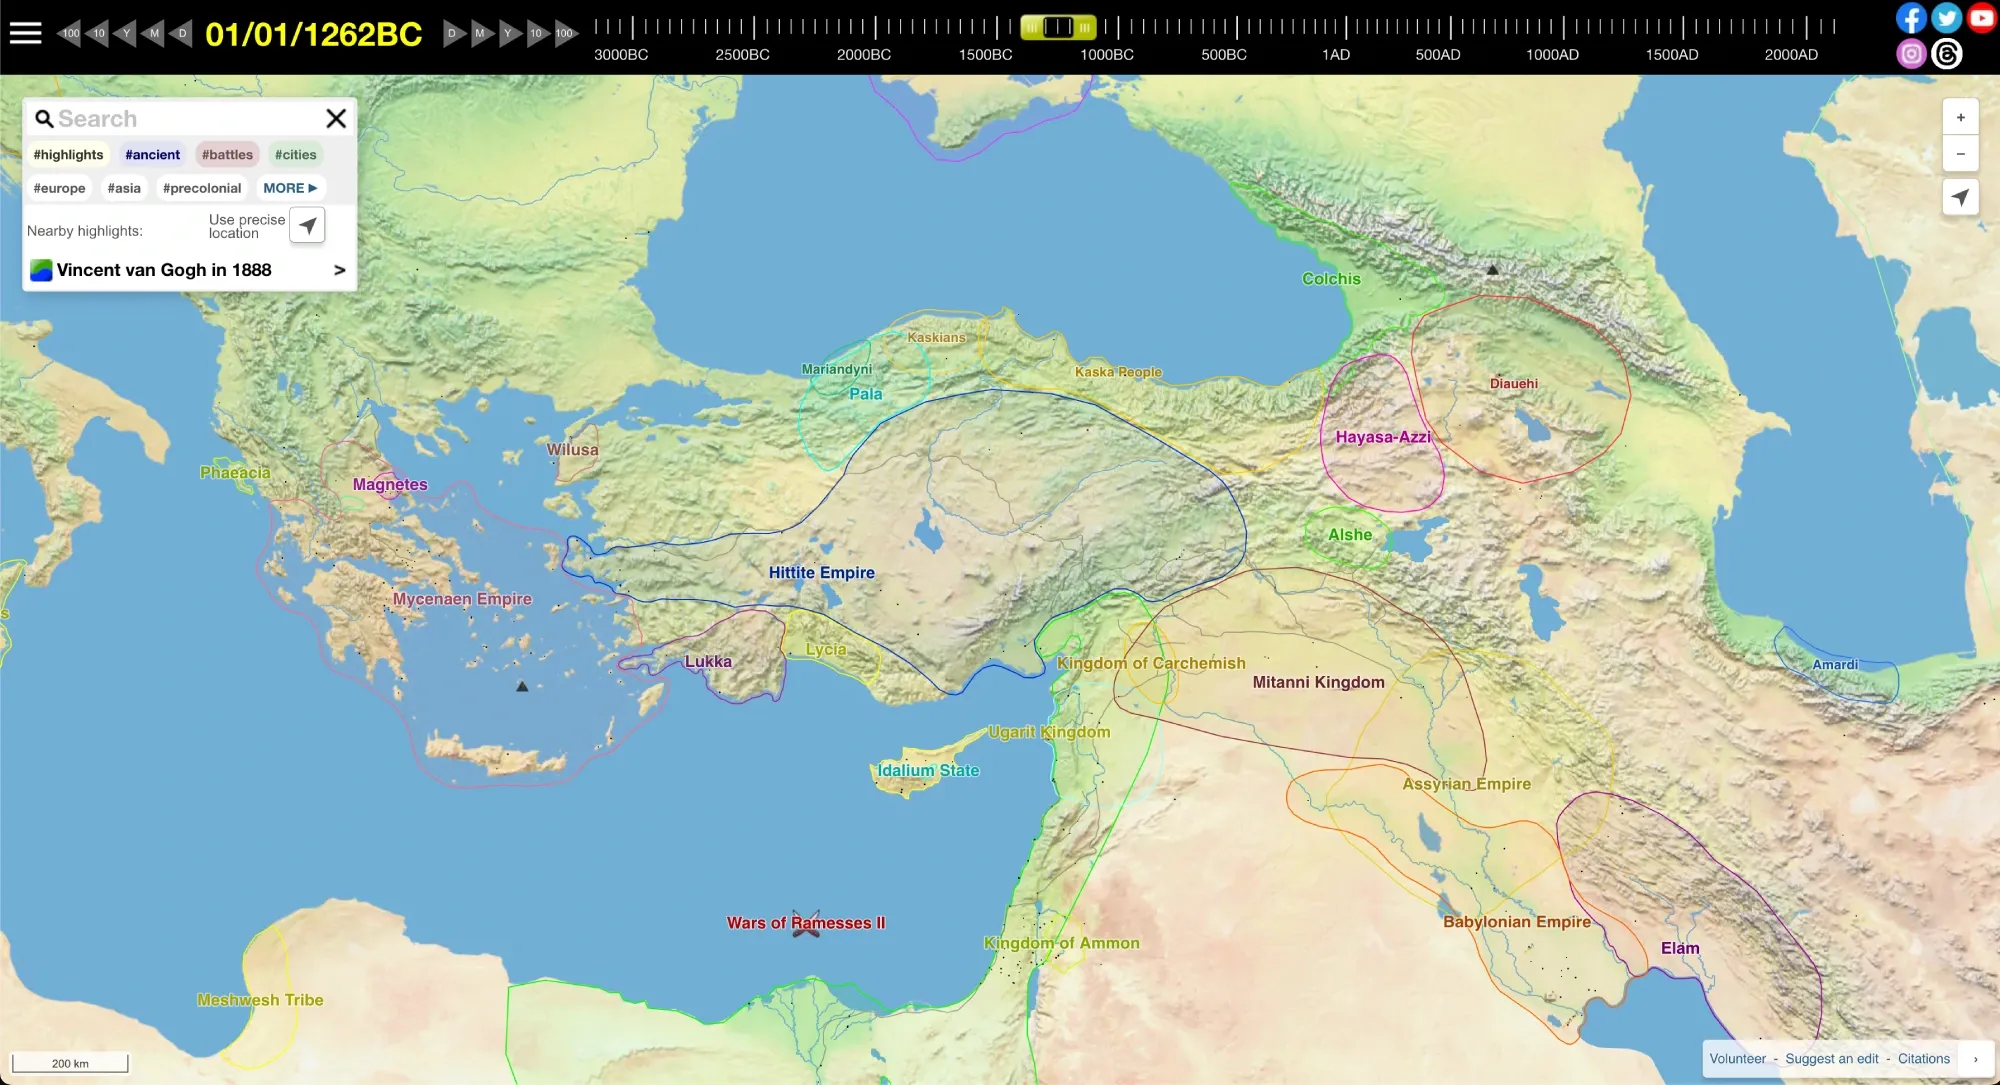
Credit: runningreality.org
For instance, an animated time-series map could depict the expansion of urban areas over the last century, enabling urban planners to comprehend how cities have developed and to plan for future expansion. Likewise, these maps are useful for tracking historical climate changes, such as sea-level rise or deforestation, and assessing their impacts on various regions.
Conclusion: The Power of Maps
Maps are more than just visual representations of the Earth's surface; they are powerful tools that shape our understanding, influence our decisions, and drive action.
Whether through geographic maps that outline political boundaries, physical landscapes, and topographic details, or thematic maps that analyze specific data such as climate, economy, and population, maps provide invaluable insights. They tell stories, communicate complex data intuitively, and can evoke emotions and inspire change.
By leveraging the diverse types of maps, we can make informed decisions, address global challenges, and navigate our world with greater precision and purpose. Embrace the power of maps to explore, understand, and transform your world.
FAQ
What is the difference between a topographic map and a physical map, and how are they used?
A topographic map uses contour lines to depict elevations and terrain features, whereas a physical map employs colors, shading, and occasionally contour lines to show landforms, water bodies, and other natural features. Topographic maps are essential for detailed elevation analysis and navigation, while physical maps provide a broader geographical overview and are often used in urban planning.
How do thematic maps differ from general or reference maps, and what types of information do they typically display?
Thematic maps are specialized in that they focus on a particular theme or subject, such as climate, population density, or economic activity, unlike reference maps that cover general geographic features. They present data on the spatial distribution of various phenomena, utilizing visual techniques like choropleth shading, graduated symbols, or isolines to represent the information clearly.
What are the key features and uses of a political map, and how do they contrast with other types of maps?
Political maps are characterized by their depiction of geographical boundaries of countries, states, provinces, cities, and administrative divisions, using distinct colors, symbols, or labels for differentiation. Their primary uses include education, diplomacy, research, and as a reference tool. Unlike physical maps, which focus on the natural landscape, political maps emphasize human-defined boundaries, showcasing the political organization and structure.
How do cartograms differ from traditional maps, and what are some common applications of cartograms in data visualization?
Cartograms are unique in that they distort geographic shapes to represent various data variables, such as population size, GDP, or election outcomes, rather than portraying actual geographic dimensions and shapes. This method of distortion highlights patterns and trends in the data, making cartograms particularly valuable in visualizing election results, population densities, economic indicators, and environmental data. They are widely applied in the fields of politics, economics, and environmental science.
About Woosmap
Woosmap empowers businesses to optimize Location Services and Intelligence with precision and efficiency. By leveraging advanced geolocation, Store Locator, and Map API tools, Woosmap ensures accurate deliveries, streamlines address entry processes, and enhances customer satisfaction. With a strong commitment to privacy, Woosmap delivers innovative, GDPR-compliant solutions that do not collect personal data, making it a trusted partner for companies prioritizing both performance and user trust.
